Lab (14 of 19) 2
Description

Having Trouble Meeting Your Deadline?
Get your assignment on Lab (14 of 19) 2 completed on time. avoid delay and – ORDER NOW
Progress Check
Use this activity to assess whether you and your peers can:
- Under appropriate conditions, conduct a hypothesis test about a mean for a matched pairs design. State a conclusion in context.
Directions
Use the drop-down menu to learn about the three steps needed to complete this assignment.
Context
Gosset’s Seed Plot Data
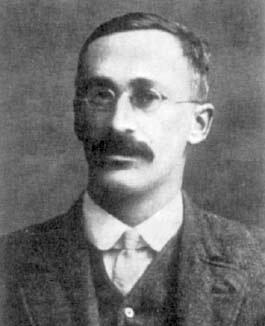
William S. Gosset was employed by the Guinness brewing company of Dublin. Sample sizes available for experimentation in brewing were necessarily small. At that time, Gosset contacted a famous statistician Karl Pearson (1857-1936) and was told that there were no techniques for developing probability models for small data sets. Gosset studied under Pearson, and the outcome of his study was perhaps the most famous paper in statistical literature, “The Probable Error of a Mean” (1908), which introduced the T-distribution.
Since Gosset was employed by Guinness, any work he produced would be owned by Guinness, so he published under a pseudonym, “Student”; hence, the T-distribution is often referred to as Student’s T-distribution.
To illustrate his analysis, Gosset used the results of seeding 11 different plots of land with two different types of seed: regular and kiln-dried. He wanted to determine if drying seeds before planting increased plant yield. Since different plots of soil may be naturally more fertile, this confounding variable was eliminated by using the matched pairs design and planting both types of seed in all 11 plots.
The resulting data (corn yield in pounds per acre) are as follows.
| Plot | Regular seed | Kiln-dried Seed |
|---|---|---|
| 1 | 1903 | 2009 |
| 2 | 1935 | 1915 |
| 3 | 1910 | 2011 |
| 4 | 2496 | 2463 |
| 5 | 2108 | 2180 |
| 6 | 1961 | 1925 |
| 7 | 2060 | 2122 |
| 8 | 1444 | 1482 |
| 9 | 1612 | 1542 |
| 10 | 1316 | 1443 |
| 11 | 1511 | 1535 |
We use these data to test the hypothesis that kiln-dried seed yields more corn than regular seed.
Because of the nature of the experimental design (matched pairs), we are testing the difference in yield.
| Plot | Regular seed | Kiln-dried Seed | Difference |
|---|---|---|---|
| 1 | 1903 | 2009 | –106 |
| 2 | 1935 | 1915 | 20 |
| 3 | 1910 | 2011 | –101 |
| 4 | 2496 | 2463 | 33 |
| 5 | 2108 | 2180 | –72 |
| 6 | 1961 | 1925 | 36 |
| 7 | 2060 | 2122 | –62 |
| 8 | 1444 | 1482 | –38 |
| 9 | 1612 | 1542 | 70 |
| 10 | 1316 | 1443 | –127 |
| 11 | 1511 | 1535 | –24 |
Note that the differences were calculated: regular − kiln-dried.
Variables
Regular seed: regular seeds that were traditionally used for planting
Kiln-dried seed: seeds that were kiln-dried before planting
Data
Open the seeds datafile in the Stats at Cuyamaca College group on StatCrunch (directions – opens in a new tab).
Prompt
- State the hypotheses and define the parameter.
- Checking conditions: Since Gosset invented the T-distribution, we will assume that his sample meets the conditions and proceed with the T-test. Regardless, answer these questions to demonstrate your understanding of the conditions for use of the T-model.
But first you will need to review the dotplots for the data (opens in a new tab).
- Which graph is used to check conditions? Why?
- What do we look for in the graph to verify that conditions are met?
- What else do we need to know about the sample of seeds before using the T-test?
- Use StatCrunch to find the T-score and the P-value. Hint: as you work through the StatCrunch directions, keep in mind that we want to calculate the differences as regular − kiln-dried . So you will choose Regular seed for Sample 1 and Kiln-dried seed for Sample 2. (directions)
Copy the information in the StatCrunch output window and paste it into the textbook with your response. - State a conclusion based on the context of this scenario.
List of StatCrunch Directions
Module 22 Discussion Board
Use the Module 22 discussion board (opens in a new tab) to ask questions or provide feedback about the problems in any Module 22 activity – including this peer-reviewed assignment.
Review Feedback
- Instructor feedback is only available after an assignment is graded.
- Use these directions (opens in a new tab) to learn how to review feedback.
Click the “Next” or > button to continue.
Content by Cuyamaca College math faculty and licensed under the Creative Commons 4.0 International LicenseLinks to an external site..
Rubric
Formative Assessments w/ StatCrunch
| Criteria | Ratings | Pts | ||||
|---|---|---|---|---|---|---|
|
This criterion is linked to a Learning OutcomeAnswering the Prompt |
|
8 pts |
||||
|
This criterion is linked to a Learning OutcomeStatCrunch |
|
2 pts |
||||
|
Total Points: 10 |
||||||
Our website has a team of professional writers who can help you write any of your homework. They will write your papers from scratch. We also have a team of editors just to make sure all papers are of HIGH QUALITY & PLAGIARISM FREE. To make an Order you only need to click Order Now and we will direct you to our Order Page at Litessays. Then fill Our Order Form with all your assignment instructions. Select your deadline and pay for your paper. You will get it few hours before your set deadline.
Fill in all the assignment paper details that are required in the order form with the standard information being the page count, deadline, academic level and type of paper. It is advisable to have this information at hand so that you can quickly fill in the necessary information needed in the form for the essay writer to be immediately assigned to your writing project. Make payment for the custom essay order to enable us to assign a suitable writer to your order. Payments are made through Paypal on a secured billing page. Finally, sit back and relax.